To date, making decisions based on data to improve union experience has mostly been an aspiration, rather than the reality for most trade unions. There are some good examples of testing and optimisation taking place (see earlier sessions on ‘joining’ in particular for this), but it’s not as widespread as it could be.
In October 2019, the TUC Digital Lab ran a session on how we could better use data to manage our unions. We wanted to discover the challenges we as unions face in developing a culture where data is regularly gathered, interrogated and acted upon.
Data and its stakeholders
Different stakeholders around the union need different data. For a digital team, that’s likely to be data about members’ use of the union’s digital services and communications. It’ll include conversion rates, ranking popular content and campaigns, click rates and engagement rates for social media, costs and returns from online marketing and so on. These can help them make tactical decisions to give members the best possible experience of their interactions with the union.
But for union leadership, these aren’t data that can help them make their decisions. They might want to know about recruitment numbers and locations, the cost of recruiting and servicing members, retention rates and the success of campaigns. Overall, these add up to the organising and financial health of the union, and may be used to make big, long-term strategic decisions.
Beyond that, other functions within the union have different needs too. If you’re in a branch, or in membership, or in organising, or a call centre, or are a lawyer, or a policy researcher, each role will have data that helps you do your job better and make better informed decisions. And all that data needs to be contextualised, so you don’t just see what’s important about the work you do, but how it fits into the wider work of the union.
Exercise: What data for which stakeholders?
- Look at your union’s organisational chart (or sketch one if you don’t have one)
- For each person or team, think about and list the data they need to do their job.
- What are the most important pieces of data for everyone to have access to or reports on?
- Over what timeframe should these data be made available and analysed? Do senior stakeholders need daily, weekly or monthly updates?
- How might you present this data to the organisation so it’s easy to understand?
Data and the user journey
We then mapped this stakeholder data across the member journey, from the time they join, through working as a union member, to needing help and advice, and finally to leaving the union through retirement or changing job. The goal of this exercise is to create a sort of dashboard for the operation of a union – one tool (of many) that can help make a case for action that colleagues across the organisation can understand and agree on.
Putting the member journey across the top of a table (e.g. from joining to retirement and every step in between) and the stakeholders down the left hand side, we create a grid we can start to fill in:
| Stakeholder / Stage | Joining the union | Onboarding | Getting help etc. |
| Senior Managers | New members Types of member Revenue from new members Cost to recruit a member Growth sectors | ||
| Membership team | Completed applications | ||
| Branch officers | Members assigned to branch | ||
| Organising team | Membership growth in target workplaces | ||
| Member services | |||
| Digital comms team | Recruitment ad click rate Cost of ads Join form conversion rate | ||
| Members | Size of the union Change over time | ||
| Etc |
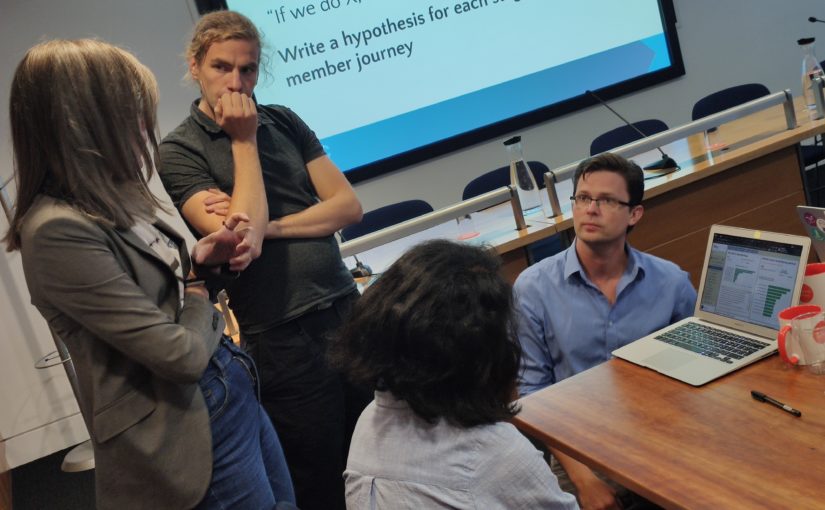
During the session, we spent time in groups filling in the table (example column above) and discussing how you could collect and present all of this information on a regular basis.
We noted that the data would come from different places all around the union – from finance, from membership, from organising and so on. Other data comes direct from common digital tools, such as Google Analytics, CRM, email software and so on. Actionable data is a team sport.
We then thought about how we might use this dashboard to measure and manage our digital programme and how this would interact with the rest of the union’s work. Knowledge of this would build up over time, as we learn about how different metrics affect the performance of the union. The direction we want many of these metrics to move in is obvious (number of applications – up!, cost of acquisition – down!), while others are more strategic in nature (which sectors provide an opportunity for growth?).
Once you know what you’re looking for, observe the data for a while and compare it with previous time periods (it could be last week for a click-through rate, or last year if, for example, your recruitment follows an annual cycle). If metrics are going in the wrong direction, it’s time to take action. The data will give you the framing for the question you’re trying to answer – our cost of acquisition is increasing, why is that? How can we dig more deeply to try and solve the problem
Exercise: Start your own dashboard
- Map out the member journey for your union
- Fill it in with your stakeholders
- Start to get the data to fill it in
- Work out what a ‘good’ metric would look like
- Maintain the dashboard for a few months to get a ‘feel’ for overall performance
- Start to experiment with data-driven improvements
Follow-up reading: Avinash Kaushik’s excellent blog ‘Occam’s Razor’ is a wonderful resource for all things analytics, and makes excellent arguments about how to use data to influence the rest of the organisation to improve. We strongly recommend you read it, and the archive has lots of lessons on specific challenges.
The good and bad of data
Many organisations collect too much data. For some, it’s their entire business model (see Shoshana Zuboff’s “Surveillance Capitalism” for a really deep exploration of this). Our goal, as unions, is to do things that benefit the members of the union, which certainly means collecting data about them and some of their activities, but it doesn’t mean being unnecessarily invasive.
Furthermore, the law governing many aspects of union data (GDPR) is complex and unproven, and with Brexit, it’s not clear how legal precedent will be set or enforced in future. This significant grey area leads to fear and doubt about the very act of collecting and using data.
It doesn’t have to be this way.
First, adopt the principle of data minimisation.
Do you really need to collect a particular piece of data? What are you using it for? Is collecting it in the member’s interest or an absolute requirement of our ability to function as a union? When will we no longer need the data?
Second, document it and be transparent.
Ask yourselves – on what basis are we collecting data? Are we telling members this clearly in language they’ll understand? Are we regularly auditing our own practices (at least annually)?
Third, ask for help.
If you’re collecting or processing data, you should have a data protection officer in the organisation. They can help you get the answer you need about data you want to collect. Beyond your union, the Information Commissioner is the regulator and have a useful helpline that can give advice. It’s just as much their job to make sure you don’t cross the line, rather than punishing organisations for doing so.
Data protection can seem like a minefield, but adopting these principles and precautions will help you avoid many of the risks of stepping on anything nasty.
Building a data culture
A key point in all this is that thinking in a data-driven way requires a data culture – a comfort with gathering, interrogating and acting upon the numbers and measures that signify the health, or not, of our organisations.
So we looked at a case study where union people are trying to build a data culture.
Talking about Data Club
Richard Landry took us through the story of UNISON’s Data Club, a small, regular gathering of colleagues where they discuss data and how to use it better to help the union. Richard saw the need for something like this because in his previous analyst roles outside the union movement, he was regularly in contact with other functions of the organisation, looking to improve their results. As the first digital data analyst at UNISON, this wasn’t the norm, so he and his digital comms colleague Alison Charlton decided to start bringing people together in an informal way to help build that culture.
There’s an open invite to Data Club. People bring their lunch, and talk to each other about data-based projects and questions they’re working on. Everyone can feed back on each others’ presentations, and often it helps to get extra perspectives on ways to get around a problem, or fresh new insights into an existing set of results.
All this fits into a wider pattern of transformation at UNISON, where investment in new data systems and CRM is putting a focus onto questions about what data the union needs, where it should be stored, and how it can be provided to staff so that they can act on it in as near to real-time as possible.
Exercise: Try starting your own Data Club
- Decide a topic – e.g. member recruitment
- Pick a time everyone should be able to make (Maybe make it regular – e.g. lunchtime once a month)
- Invite colleagues
- Provide food if resources allow. This is a great way to put people at ease and help them to open up more in a less formal setting.
- Discuss the topic at hand and agree next steps – What data are we collecting? What can it tell us? What might we do with it? What don’t we know? What should we do?
- Set a date for the next session, where you’ll present findings about this topic, and discuss a new one.
Note: In Q&A with Richard, the topic of CRM came up several times, and as part of the Digital Lab in 2020, we’ll be looking to run a session solely on new systems and managing changeovers this year. Sign up to the Digital Lab email list to get news about all sessions in 2020.
The onward journey
As we said at the beginning of this blog post, we’ve heard of isolated examples of unions using data to test and improve elements of their digital estate, particularly the joining process. However, we’ve not yet seen anyone taking a truly holistic approach.
We’d be really interested to hear from and work with any unions who want to take further steps in this area, to produce their own working dashboard and start to grapple with the issues of making it a common tool within the union for improving results.
Let us know if you’re having a go!
Sam Jeffers (of The Shop) is a consultant to the TUC Digital Lab, and facilitator for the workshop series.

