
Member engagement is a big priority for the CSP. It gives value to our members for being part of the community. It really helps with recruitment as well, because happy, engaged members are really good advocates for future CSP membership. And an engaged membership helps the union be better informed, more active and more influential, through members’ input.
The union has a couple of objectives around engagement in its corporate strategy. Firstly, we want to increase the overall engagement levels of members. And secondly we aim to make sure that there’s no gap between the engagement of members as a whole, and that of members from marginalised groups. This is measured so we can explore any differences they notice and remove any barriers to equal participation.
But to be able to do those two things, we need to understand where members are right now, so we can plan in an informed way. And we also need to be able to measure the impact of what we’re doing as we try new things.
But how do you measure that? We don’t have a single pre-existing measurement of engagement. Our CRM is pretty basic and doesn’t have built in engagement modelling, so we can’t simply look at a member record and see an automatic score.
So our challenge has been to get some meaningful insight that we can actually use, with the limited data and resources that we’ve got.
The engagement model
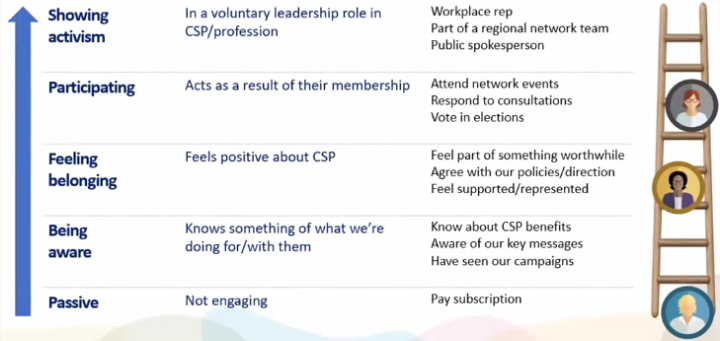
We have a member engagement strategy. It’s based around a ladder model and it recognizes that there are various different forms of engagement, and it’s not all about being really active and involved the whole time.
It starts with having an awareness of what you’re getting for your subscriptions, up through feeling like belonging to a worthwhile community in the union. Then there’s a participation level where we’re getting people to do things as a result of membership (such as turning up to events or joining a consultation).
And then right at the top, the really valuable level, where people are taking on voluntary leadership roles. Members will be a different levels and may change over time. So the model recognises they’re in those different places, but it gives us some structure around which we can start to measure what we know about our membership.
Measuring engagement
In the union, we have a lot of data, from different sources.
We have data about the interactions that members have with us, whether they turn up at events, whether sign up to a campaign.
We have data about whether members have taken on voluntary positions, like becoming workplace reps or going on a committee.
And we have lots of survey data about members’ perceptions of membership and what they’re doing as a result of their membership. We’ve moved to using a member survey with about 50 questions. We run it four times a year, but we split the membership and only invite members to take part in alternate ones. Staggering them this way helps us get a more regular benchmark, without needing to go to all members too often.
So with all those different data sources that we’ve got, we map them against the different levels of the engagement ladder. This means we can start to get a sense of how aware members are of what they get from us, right up to the activist level how much activism is there among the membership, and we can track changes in that over time.
At the awareness level, we’re collecting data on the usage of our different comms channels. Some of that’s automated, some of that’s by members telling us what they’re using and what they value. We ask them about their awareness of the benefits of membership. We ask them about campaigns that we’ve run and test the recall rate on those. All of that and more contributes towards their level of awareness.
For the sense of belonging, we ask them about whether they agree with our policy positions, and how likely they are to advocate for them. We use net promoter score here too.
For participation we look at things like how many people turn up at our events and webinars. How many people sign up to a campaign and do something to support it. How many people vote in ballots.
And then for the activism level at the top, we’re looking at the number of reps that we’ve got, the people that tell us that they’re doing influencing work in support of our strategy, or coordinating activity with other members.
Because we don’t currently have a fancy CRM that can do this for us, we have to bring all of that data together ourselves, using Excel. We weight the different attributes of that data to give us overall index scores.
Segmentation
We also segment it for different types of membership. At the moment we segment by three different types of protected characteristic because we have that equality objective.
But we are looking at using other segments like different grades of membership or regions that people are based in, so we can spot differences there.
Interpreting the results
Once we’ve mapped the data that we’ve got against those different levels of the engagement model, we can start to track changes over time. Here is a graph of the first three quarters of this year.
We baselined the first measurement to 250 points on each category of the model, so they add up nicely to 1,000. We do use the overall total as it changes over subsequent quarters, but we also break it down so we can track if each part of the model rises or falls.
We’re tracking these charts not just for the whole membership, but also making charts for the segments of membership that we’re interested in.
The breakdowns help us look into the data behind the scenes to see what is causing those changes. So where we’ve got a big increase in participation here, we can look back at the workings of the model and see that actually that’s been driven by a lot more members recruiting other members in quarter 2, as we did a push on our member-get-member scheme.
We think that participation will drop again soon because it includes an element of people voting in industrial action consultations and ballots, which have been extremely high over the last year. We would expect awareness to be hit because we saw that we were getting lower recall of some of our key campaigns. That’s meant we could then boost campaign visibility on those with the groups where we’re seeing bigger drops.
Building belonging is a really big priority for us. We’ve looked at the scores, tried some new actions and we’ve seen that they’ve started to have an effect.
The model itself is really handy. It’s not cost us in terms of technology to develop, though it does cost us in terms of the time of people working on collecting and processing the data. It is still pretty rough and ready, but crucially it does work in lifting what we know about members above just the anecdotal. And that means we’ve got more confidence in our decisions because we have data to back up the choices we make.
In the future, it’d be great to have a more developed CRM in place that can help us with that. But for now, it means that we can still go ahead and make business decisions based on what we know.
And also we quite like that it’s not a black box. We know pretty much now what the caveats are to our data. So if we’re making decisions, we’re doing it knowing what the limitations of the data are.
We can also see what’s influencing the results and we can make adjustments to the weighting behind the scenes if we need to.
There are limitations to it, of course. It takes some effort – the reports don’t happen automatically. Another limitation is that it relies on a lot of survey data and that is self-selecting for the people who are willing to take surveys.
The 10% response rate we get to our member quarterly membership surveys is pretty good, but that means we can only go with what we know, and there are still a lot of perspectives we will be missing. It’s even more of an issue where we segment to different characteristics and the sample sizes start to get pretty small.
What’s next?
More automation will be really useful to reduce the level of work needed. Initially that’s about the data management and the report generation. We are trying to build this into something that requires less effort every quarter to come out with the figures.
But we are also moving towards studying more of this data at the individual level, rather than the member segment level. That will help us personalize the messages that we send, and also target interventions to people who fit a profile that may need it more. That’s another opportunity for automation, where we can trigger particular processes, based on how many members have fallen into a relevant profile that quarter.
Rob Ledger is Assistant Director of Strategic Communications at the Chartered Society of Physiotherapy